import numpy as np
import pandas as pd
import matplotlib.pyplot as plt
import networkx as nx
import sklearn
import xgboost as xgb

# sklearn
from sklearn import model_selection # split함수이용
from sklearn import ensemble # RF,GBM
from sklearn import metrics
from sklearn.metrics import precision_score, recall_score, f1_score
from sklearn.svm import SVC
from sklearn.ensemble import RandomForestClassifier
from sklearn.naive_bayes import GaussianNB

# gnn
import torch
import torch.nn.functional as F
import torch_geometric
from torch_geometric.nn import GCNConv
imports
def down_sample_textbook(df):
    df_majority = df[df.is_fraud==0].copy()
    df_minority = df[df.is_fraud==1].copy()
    df_maj_dowsampled = sklearn.utils.resample(df_majority, n_samples=len(df_minority), replace=False, random_state=42)
    df_downsampled = pd.concat([df_minority, df_maj_dowsampled])
    return df_downsampled

def compute_time_difference(group):
    n = len(group)
    result = []
    for i in range(n):
        for j in range(n):
            time_difference = abs(group.iloc[i].trans_date_trans_time.value - group.iloc[j].trans_date_trans_time.value)
            result.append([group.iloc[i].name, group.iloc[j].name, time_difference])
    return result

def mask(df):
    df_tr,df_test = sklearn.model_selection.train_test_split(df, random_state=42)
    N = len(df)
    train_mask = [i in df_tr.index for i in range(N)]
    test_mask = [i in df_test.index for i in range(N)]
    train_mask = np.array(train_mask)
    test_mask = np.array(test_mask)
    return train_mask, test_mask

def edge_index_selected(edge_index):
    theta = edge_index[:,2].mean()
    edge_index[:,2] = (np.exp(-edge_index[:,2]/theta) != 1)*(np.exp(-edge_index[:,2]/theta))
    edge_index = edge_index.tolist()
    mean_ = np.array(edge_index)[:,2].mean()
    selected_edges = [(int(row[0]), int(row[1])) for row in edge_index if row[2] > mean_]
    edge_index_selected = torch.tensor(selected_edges, dtype=torch.long).t()
    return edge_index_selected
fraudTrain = pd.read_csv("~/Desktop/fraudTrain.csv").iloc[:,1:]fraudTrain = fraudTrain.assign(trans_date_trans_time= list(map(lambda x: pd.to_datetime(x), fraudTrain.trans_date_trans_time)))
fraudTrain| trans_date_trans_time | cc_num | merchant | category | amt | first | last | gender | street | city | ... | lat | long | city_pop | job | dob | trans_num | unix_time | merch_lat | merch_long | is_fraud | |
|---|---|---|---|---|---|---|---|---|---|---|---|---|---|---|---|---|---|---|---|---|---|
| 0 | 2019-01-01 00:00:00 | 2.703190e+15 | fraud_Rippin, Kub and Mann | misc_net | 4.97 | Jennifer | Banks | F | 561 Perry Cove | Moravian Falls | ... | 36.0788 | -81.1781 | 3495 | Psychologist, counselling | 1988-03-09 | 0b242abb623afc578575680df30655b9 | 1325376018 | 36.011293 | -82.048315 | 0 |
| 1 | 2019-01-01 00:00:00 | 6.304230e+11 | fraud_Heller, Gutmann and Zieme | grocery_pos | 107.23 | Stephanie | Gill | F | 43039 Riley Greens Suite 393 | Orient | ... | 48.8878 | -118.2105 | 149 | Special educational needs teacher | 1978-06-21 | 1f76529f8574734946361c461b024d99 | 1325376044 | 49.159047 | -118.186462 | 0 |
| 2 | 2019-01-01 00:00:00 | 3.885950e+13 | fraud_Lind-Buckridge | entertainment | 220.11 | Edward | Sanchez | M | 594 White Dale Suite 530 | Malad City | ... | 42.1808 | -112.2620 | 4154 | Nature conservation officer | 1962-01-19 | a1a22d70485983eac12b5b88dad1cf95 | 1325376051 | 43.150704 | -112.154481 | 0 |
| 3 | 2019-01-01 00:01:00 | 3.534090e+15 | fraud_Kutch, Hermiston and Farrell | gas_transport | 45.00 | Jeremy | White | M | 9443 Cynthia Court Apt. 038 | Boulder | ... | 46.2306 | -112.1138 | 1939 | Patent attorney | 1967-01-12 | 6b849c168bdad6f867558c3793159a81 | 1325376076 | 47.034331 | -112.561071 | 0 |
| 4 | 2019-01-01 00:03:00 | 3.755340e+14 | fraud_Keeling-Crist | misc_pos | 41.96 | Tyler | Garcia | M | 408 Bradley Rest | Doe Hill | ... | 38.4207 | -79.4629 | 99 | Dance movement psychotherapist | 1986-03-28 | a41d7549acf90789359a9aa5346dcb46 | 1325376186 | 38.674999 | -78.632459 | 0 |
| ... | ... | ... | ... | ... | ... | ... | ... | ... | ... | ... | ... | ... | ... | ... | ... | ... | ... | ... | ... | ... | ... |
| 1048570 | 2020-03-10 16:07:00 | 6.011980e+15 | fraud_Fadel Inc | health_fitness | 77.00 | Haley | Wagner | F | 05561 Farrell Crescent | Annapolis | ... | 39.0305 | -76.5515 | 92106 | Accountant, chartered certified | 1943-05-28 | 45ecd198c65e81e597db22e8d2ef7361 | 1362931649 | 38.779464 | -76.317042 | 0 |
| 1048571 | 2020-03-10 16:07:00 | 4.839040e+15 | fraud_Cremin, Hamill and Reichel | misc_pos | 116.94 | Meredith | Campbell | F | 043 Hanson Turnpike | Hedrick | ... | 41.1826 | -92.3097 | 1583 | Geochemist | 1999-06-28 | c00ce51c6ebb7657474a77b9e0b51f34 | 1362931670 | 41.400318 | -92.726724 | 0 |
| 1048572 | 2020-03-10 16:08:00 | 5.718440e+11 | fraud_O'Connell, Botsford and Hand | home | 21.27 | Susan | Mills | F | 005 Cody Estates | Louisville | ... | 38.2507 | -85.7476 | 736284 | Engineering geologist | 1952-04-02 | 17c9dc8b2a6449ca2473726346e58e6c | 1362931711 | 37.293339 | -84.798122 | 0 |
| 1048573 | 2020-03-10 16:08:00 | 4.646850e+18 | fraud_Thompson-Gleason | health_fitness | 9.52 | Julia | Bell | F | 576 House Crossroad | West Sayville | ... | 40.7320 | -73.1000 | 4056 | Film/video editor | 1990-06-25 | 5ca650881b48a6a38754f841c23b77ab | 1362931718 | 39.773077 | -72.213209 | 0 |
| 1048574 | 2020-03-10 16:08:00 | 2.283740e+15 | fraud_Buckridge PLC | misc_pos | 6.81 | Shannon | Williams | F | 9345 Spencer Junctions Suite 183 | Alpharetta | ... | 34.0770 | -84.3033 | 165556 | Prison officer | 1997-12-27 | 8d0a575fe635bbde12f1a2bffc126731 | 1362931730 | 33.601468 | -83.891921 | 0 |
1048575 rows × 22 columns
데이터정리
_df1 = fraudTrain[fraudTrain["is_fraud"] == 0].sample(frac=0.20, random_state=42)
_df2 = fraudTrain[fraudTrain["is_fraud"] == 1]
df02 = pd.concat([_df1,_df2])
df02.shape
(214520, 22)df50 = down_sample_textbook(df02)
df50 = df50.reset_index()
df50.shape(12012, 23)tr/test
mask(df50)(array([False, True, True, ..., True, False, True]),
array([ True, False, False, ..., False, True, False]))train_mask, test_mask = mask(df50)edge_index 설정
# groups = df50.groupby('cc_num')
# edge_index_list_plus = [compute_time_difference(group) for _, group in groups]
# edge_index_list_plus_flat = [item for sublist in edge_index_list_plus for item in sublist]
# edge_index_list_plus_nparr = np.array(edge_index_list_plus_flat)
# np.save('edge_index_list_plus50.npy', edge_index_list_plus_nparr)
edge_index = np.load('edge_index_list_plus50.npy').astype(np.float64)
edge_index.shape(200706, 3)edge_index_selected = edge_index_selected(edge_index)edge_index_selectedtensor([[ 1023, 1023, 1023, ..., 11944, 11944, 11944],
[ 1024, 1028, 1031, ..., 4257, 9241, 9782]])np.array(edge_index_selected)array([[ 1023, 1023, 1023, ..., 11944, 11944, 11944],
[ 1024, 1028, 1031, ..., 4257, 9241, 9782]])분석 1(GCN): amt
x = torch.tensor(df50['amt'], dtype=torch.float).reshape(-1,1)
y = torch.tensor(df50['is_fraud'],dtype=torch.int64)
data = torch_geometric.data.Data(x=x, edge_index = edge_index_selected, y=y, train_mask = train_mask, test_mask = test_mask)
data


torch.manual_seed(202250926)
class GCN2(torch.nn.Module):
    def __init__(self):
        super().__init__()
        self.conv1 = GCNConv(1, 32)
        self.conv2 = GCNConv(32,2)

    def forward(self, data):
        x, edge_index = data.x, data.edge_index

        x = self.conv1(x, edge_index)
        x = F.relu(x)
        x = F.dropout(x, training=self.training)
        x = self.conv2(x, edge_index)

        return F.log_softmax(x, dim=1)

X = (data.x[data.train_mask]).numpy()
XX = (data.x[data.test_mask]).numpy()
y = (data.y[data.train_mask]).numpy()
yy = (data.y[data.test_mask]).numpy()

model = GCN2()
optimizer = torch.optim.Adam(model.parameters(), lr=0.01, weight_decay=5e-4)
model.train()
for epoch in range(400):
    optimizer.zero_grad()
    out = model(data)
    loss = F.nll_loss(out[data.train_mask], data.y[data.train_mask])
    loss.backward()
    optimizer.step()
model.eval()

pred = model(data).argmax(dim=1)
yyhat = pred[data.test_mask]

metrics = [sklearn.metrics.accuracy_score,
           sklearn.metrics.precision_score,
           sklearn.metrics.recall_score,
           sklearn.metrics.f1_score]

_results1= pd.DataFrame({m.__name__:[m(yy,yyhat).round(6)] for m in metrics},index=['분석1'])
_results1| accuracy_score | precision_score | recall_score | f1_score | |
|---|---|---|---|---|
| 분석1 | 0.902098 | 0.862478 | 0.95913 | 0.90824 |
import matplotlib.pyplot as pltG = torch_geometric.utils.to_networkx(data, to_undirected=True)pos = nx.spring_layout(G)
labels = {i: f"{i}\n{data.y[i].item()}" for i in range(data.num_nodes)}
nx.draw(G, pos, with_labels=True, node_color='lightblue', labels=labels)
plt.show()
anomaly_nodes = [i for i in range(data.num_nodes) if data.y[i].item() == 1]

# 중요한 노드에 대한 레이블 설정
labels = {i: f"{i}\n{data.y[i].item()}" for i in anomaly_nodes}

# 중요한 노드 강조
node_color = ['lightblue' if i not in anomaly_nodes else 'red' for i in range(data.num_nodes)]

# 그래프 시각화
nx.draw(G, pos, with_labels=True, node_color=node_color, labels=labels)
plt.show()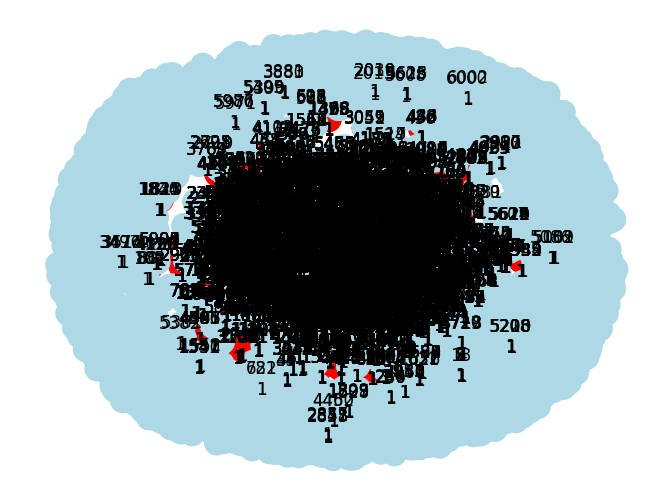
G<networkx.classes.graph.Graph at 0x7f3eaffc0880>흠…..
import networkx as nx
import matplotlib.pyplot as plt

# PyTorch Geometric 그래프를 NetworkX 그래프로 변환
G = torch_geometric.utils.to_networkx(data, to_undirected=True)

# 노드 A와 B의 인덱스
node_A_index = 1023
node_B_index = 1024

# 노드 A와 B 간의 경로 찾기
shortest_path = nx.shortest_path(G, source=node_A_index, target=node_B_index)

# 노드 A와 B 간의 경로로 이루어진 부분 그래프 추출
subgraph = G.subgraph(shortest_path)

# 그래프 시각화
pos = nx.spring_layout(subgraph)  # 그래프 레이아웃 설정

# 노드 그리기
nx.draw_networkx_nodes(subgraph, pos, node_size=200)

# 엣지 그리기
nx.draw_networkx_edges(subgraph, pos)

# 그래프 출력
plt.axis('off')  # 축 숨기기
plt.show()
subgraph = nx.ego_graph(G, 1023, radius=1)

# 그래프 시각화
pos = nx.spring_layout(subgraph)  # 그래프 레이아웃 설정

# 노드 그리기
nx.draw_networkx_nodes(subgraph, pos, node_size=200)

# 엣지 그리기
nx.draw_networkx_edges(subgraph, pos)

# 그래프 출력
plt.axis('off')  # 축 숨기기
plt.show()
import networkx as nx
import matplotlib.pyplot as plt

# PyTorch Geometric 그래프를 NetworkX 그래프로 변환
G = torch_geometric.utils.to_networkx(data, to_undirected=True)

# 노드 1023과 연결된 모든 노드와 엣지를 포함하는 부분 그래프 추출
subgraph = nx.ego_graph(G, 1023, radius=1)

# 그래프 시각화
pos = nx.spring_layout(subgraph)  # 그래프 레이아웃 설정

# 노드 그리기
nx.draw_networkx_nodes(subgraph, pos, node_size=200)

# 엣지 그리기
nx.draw_networkx_edges(subgraph, pos)

# 노드 인덱스 표시
labels = {node: str(node) for node in subgraph.nodes()}
nx.draw_networkx_labels(subgraph, pos, labels, font_size=10)

# 그래프 출력
plt.axis('off')  # 축 숨기기
plt.show()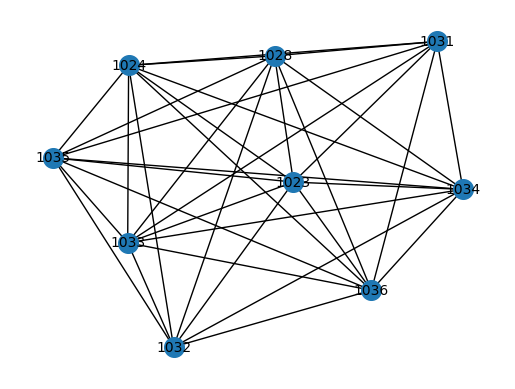
import networkx as nx
import matplotlib.pyplot as plt

# PyTorch Geometric 그래프를 NetworkX 그래프로 변환
G = torch_geometric.utils.to_networkx(data, to_undirected=True)

subgraph = nx.ego_graph(G, 9782, radius=1)

# 그래프 시각화
pos = nx.spring_layout(subgraph)  # 그래프 레이아웃 설정

# 노드 그리기
nx.draw_networkx_nodes(subgraph, pos, node_size=200)

# 엣지 그리기
nx.draw_networkx_edges(subgraph, pos)

# 노드 인덱스 표시
labels = {node: str(node) for node in subgraph.nodes()}
nx.draw_networkx_labels(subgraph, pos, labels, font_size=10)

# 그래프 출력
plt.axis('off')  # 축 숨기기
plt.show()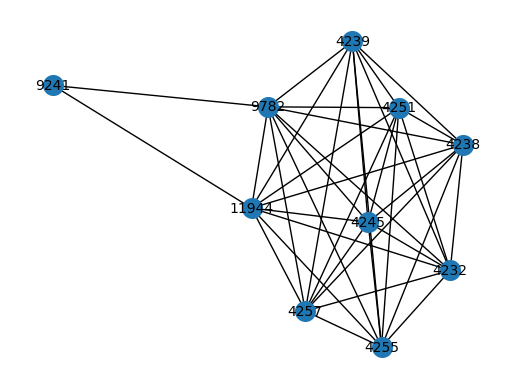
import networkx as nx
import matplotlib.pyplot as plt

# PyTorch Geometric 그래프를 NetworkX 그래프로 변환
G = torch_geometric.utils.to_networkx(data, to_undirected=True)

# 노드 1023과 연결된 모든 노드와 엣지를 포함하는 부분 그래프 추출
subgraph1 = nx.ego_graph(G, 1023, radius=1)
subgraph2 = nx.ego_graph(G, 9782, radius=1)

# 그래프 시각화
pos1 = nx.spring_layout(subgraph1)  # 그래프 레이아웃 설정
pos2 = nx.spring_layout(subgraph2)

# 노드 그리기
nx.draw_networkx_nodes(subgraph1, pos1, node_size=200, node_color='b', label='Node 1023')
nx.draw_networkx_nodes(subgraph2, pos2, node_size=200, node_color='g', label='Node 1024')

# 엣지 그리기
nx.draw_networkx_edges(subgraph1, pos1)
nx.draw_networkx_edges(subgraph2, pos2)

# 노드 인덱스 표시
labels1 = {node: str(node) for node in subgraph1.nodes()}
labels2 = {node: str(node) for node in subgraph2.nodes()}
nx.draw_networkx_labels(subgraph1, pos1, labels1, font_size=10)
nx.draw_networkx_labels(subgraph2, pos2, labels2, font_size=10)

# 그래프 출력
plt.axis('off')  # 축 숨기기

# 레이블 표시
plt.legend(loc='best')

plt.show()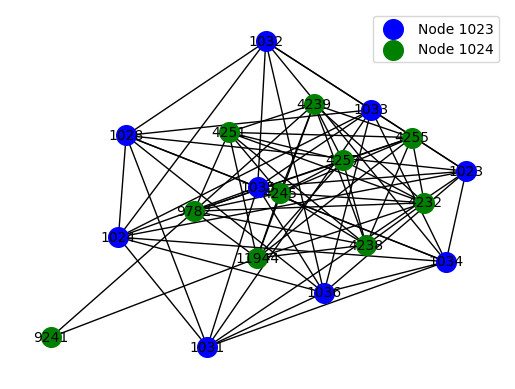
# 노드 1023와 9782 간의 연결 확인
are_connected = G.has_edge(1023, 9782)

if are_connected:
    print("Node 1023 and Node 9782 are connected.")
else:
    print("Node 1023 and Node 9782 are not connected.")
Node 1023 and Node 9782 are not connected.import networkx as nx
import matplotlib.pyplot as plt
# PyTorch Geometric 그래프를 NetworkX 그래프로 변환
G = torch_geometric.utils.to_networkx(data, to_undirected=True)
# 노드 1023과 연결된 모든 노드와 엣지를 포함하는 부분 그래프 추출
subgraph1 = nx.ego_graph(G, 1023, radius=1)
subgraph2 = nx.ego_graph(G, 9782, radius=1)
# 왼쪽 그래프 레이아웃 설정
pos1 = nx.spring_layout(subgraph1, pos=None, seed=42) # 그래프 레이아웃 설정
# 오른쪽 그래프 레이아웃 설정
pos2 = nx.spring_layout(subgraph2, pos=None, seed=43)
# 노드 그리기
nx.draw_networkx_nodes(subgraph1, pos1, node_size=200, node_color='b', label='Node 1023')
nx.draw_networkx_nodes(subgraph2, pos2, node_size=200, node_color='g', label='Node 1024')
# 엣지 그리기
nx.draw_networkx_edges(subgraph1, pos1)
nx.draw_networkx_edges(subgraph2, pos2)
# 노드 인덱스 표시
labels1 = {node: str(node) for node in subgraph1.nodes()}
labels2 = {node: str(node) for node in subgraph2.nodes()}
nx.draw_networkx_labels(subgraph1, pos1, labels1, font_size=10)
nx.draw_networkx_labels(subgraph2, pos2, labels2, font_size=10)
# 그래프 출력
plt.axis('off') # 축 숨기기
# 레이블 표시
plt.legend(loc='best')
plt.show()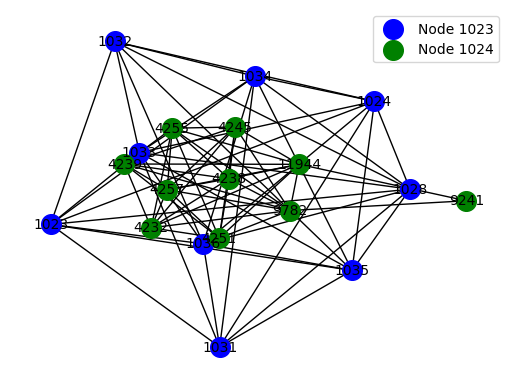
len(df50['cc_num'].unique())932df50['cc_num'].value_counts()4.302480e+15 43
1.800650e+14 36
2.131740e+14 35
2.720430e+15 34
2.242540e+15 33
..
3.885950e+13 1
4.026220e+12 1
6.526450e+15 1
4.972230e+15 1
6.535330e+15 1
Name: cc_num, Length: 932, dtype: int64cc_num_counts = df50['cc_num'].value_counts()
mean_counts = cc_num_counts.mean()
mean_counts12.888412017167383counts = df50['cc_num'].value_counts()
cc_num_with_13_counts = counts[counts == 13].index
cc_num_with_13_countsFloat64Index([3585740000000000.0, 4839040000000000.0, 370349000000000.0,
3583090000000000.0, 3534720000000000.0, 342351000000000.0,
213161000000000.0, 6011860000000000.0, 2288810000000000.0,
560881000000.0, 346273000000000.0, 4760120000000.0,
2356280000000000.0, 501803000000.0, 2297450000000000.0,
4933460000000000.0, 3565940000000000.0, 3597980000000000.0,
36913600000000.0, 630423000000.0, 4746000000000.0,
3536820000000000.0, 2720890000000000.0, 4.537e+18,
4755700000000.0, 38057500000000.0, 4.2929e+18,
6011230000000000.0, 4060580000000000.0, 3546900000000000.0,
345060000000000.0, 30596500000000.0, 3597340000000000.0,
4124540000000000.0, 4204240000000000.0, 375237000000000.0,
36153900000000.0, 4334230000000000.0, 6012000000000000.0,
4134460000000000.0, 4653880000000000.0, 4509140000000000.0,
3565420000000000.0],
dtype='float64')df50[df50['cc_num'] == 4.537e+18].indexInt64Index([ 6298, 6714, 7704, 7823, 7910, 7990, 9145, 9806, 10338,
10910, 11621, 11847, 11926],
dtype='int64')import networkx as nx
import matplotlib.pyplot as plt
selected_indices = df50[df50['cc_num'] == 3585740000000000.0].index
is_fraud_values = df50.loc[selected_indices, 'is_fraud'].tolist()
G = torch_geometric.utils.to_networkx(data, to_undirected=True)
subgraph = G.subgraph(selected_indices)
node_colors = ['r' if node in selected_indices and is_fraud_values[selected_indices.get_loc(node)] == 1 else 'k' for node in subgraph.nodes()]
pos = nx.spring_layout(subgraph, seed=42)
plt.figure(figsize=(10, 5))
nx.draw_networkx_nodes(subgraph, pos, node_size=200, node_color=node_colors)
nx.draw_networkx_edges(subgraph, pos, edge_color='gray')
nx.draw_networkx_labels(subgraph, pos, font_size=10)
plt.axis('off')
plt.show()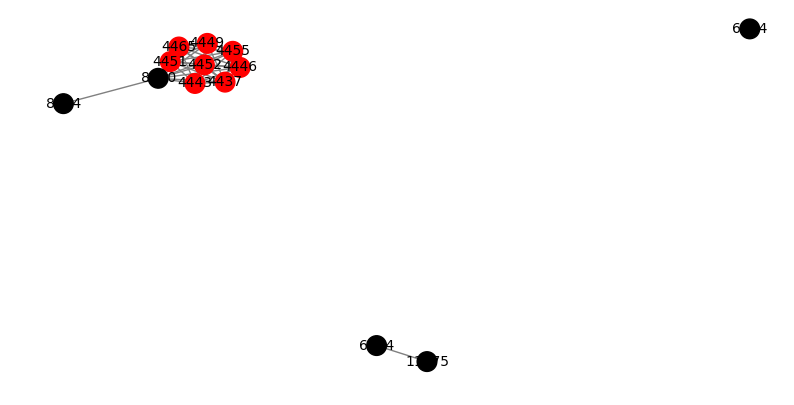
index = df50[df50['cc_num'] == 3585740000000000.0].index
is_fraud_value = df50.loc[index, 'is_fraud']
is_fraud_value
4437 1
4443 1
4446 1
4449 1
4451 1
4452 1
4455 1
4465 1
6914 0
6974 0
8624 0
8830 0
11375 0
Name: is_fraud, dtype: int64df50[df50['cc_num'] == 4.302480e+15].indexInt64Index([ 2293, 2294, 2295, 2296, 2297, 2298, 2299, 2300, 4709,
4711, 4718, 4720, 4728, 4729, 4730, 4733, 4734, 4736,
4739, 4742, 6081, 6751, 6855, 7025, 7554, 7817, 7946,
8173, 9152, 9166, 9548, 9708, 9773, 9807, 10198, 10828,
10909, 10953, 10962, 11273, 11330, 11562, 11946],
dtype='int64')index = df50[df50['cc_num'] == 4.302480e+15].index
is_fraud_value = df50.loc[index, 'is_fraud']
is_fraud_value2293 1
2294 1
2295 1
2296 1
2297 1
2298 1
2299 1
2300 1
4709 1
4711 1
4718 1
4720 1
4728 1
4729 1
4730 1
4733 1
4734 1
4736 1
4739 1
4742 1
6081 0
6751 0
6855 0
7025 0
7554 0
7817 0
7946 0
8173 0
9152 0
9166 0
9548 0
9708 0
9773 0
9807 0
10198 0
10828 0
10909 0
10953 0
10962 0
11273 0
11330 0
11562 0
11946 0
Name: is_fraud, dtype: int64- cc_num=4.302480e+15 인 그래프
해당 노드의 is_fraud=1 이면 빨간색으로 표시했다
import networkx as nx
import matplotlib.pyplot as plt

# 4.50~에 해당하는 행의 인덱스를 찾음
selected_indices = df50[df50['cc_num'] == 4.302480e+15].index

# 선택된 인덱스에 대한 is_fraud 값을 가져옴
is_fraud_values = df50.loc[selected_indices, 'is_fraud'].tolist()

# PyTorch Geometric 그래프를 NetworkX 그래프로 변환
G = torch_geometric.utils.to_networkx(data, to_undirected=True)

# 서브그래프를 추출
subgraph = G.subgraph(selected_indices)

# 노드와 엣지 색상을 설정
node_colors = ['r' if node in selected_indices and is_fraud_values[selected_indices.get_loc(node)] == 1 else 'k' for node in subgraph.nodes()]

# 그래프 레이아웃 설정
pos = nx.spring_layout(subgraph, seed=42)

# 그래프 그리기
plt.figure(figsize=(10, 5))
nx.draw_networkx_nodes(subgraph, pos, node_size=200, node_color=node_colors)
nx.draw_networkx_edges(subgraph, pos, edge_color='gray')
nx.draw_networkx_labels(subgraph, pos, font_size=10)

# 축 숨기기
plt.axis('off')

# 그래프 출력
plt.show()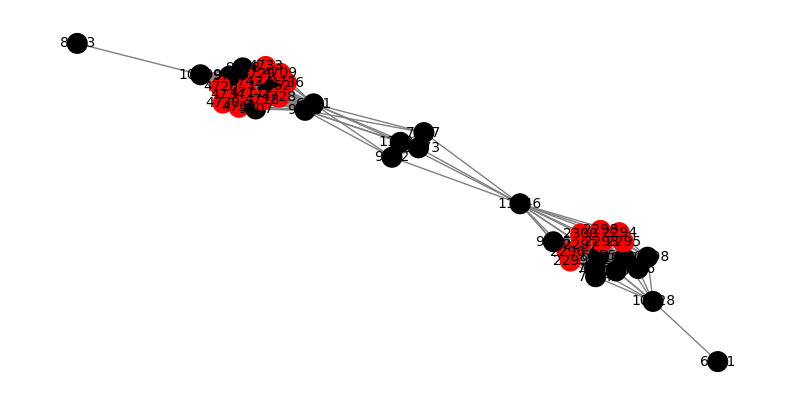
import networkx as nx
import matplotlib.pyplot as plt

# 4.30~에 해당하는 행의 인덱스를 찾음
selected_indices1 = df50[df50['cc_num'] == 4.302480e+15].index
selected_indices2 = df50[df50['cc_num'] == 2.242540e+15].index

# 선택된 인덱스에 대한 is_fraud 값을 가져옴
is_fraud_values1 = df50.loc[selected_indices1, 'is_fraud'].tolist()
is_fraud_values2 = df50.loc[selected_indices2, 'is_fraud'].tolist()

# PyTorch Geometric 그래프를 NetworkX 그래프로 변환
G = torch_geometric.utils.to_networkx(data, to_undirected=True)

# 첫 번째 서브그래프 추출
subgraph1 = G.subgraph(selected_indices1)

# 노드와 엣지 색상 설정 (서브그래프 1)
node_colors1 = ['r' if node in selected_indices1 and is_fraud_values1[selected_indices1.get_loc(node)] == 1 else 'k' for node in subgraph1.nodes()]

# 그래프 레이아웃 설정 (서브그래프 1)
pos1 = nx.spring_layout(subgraph1, seed=42)

# 두 번째 서브그래프 추출
subgraph2 = G.subgraph(selected_indices2)

# 노드와 엣지 색상 설정 (서브그래프 2)
node_colors2 = ['r' if node in selected_indices2 and is_fraud_values2[selected_indices2.get_loc(node)] == 1 else 'k' for node in subgraph2.nodes()]

# 그래프 레이아웃 설정 (서브그래프 2)
pos2 = nx.spring_layout(subgraph2, seed=43)

# 그래프 그리기
plt.figure(figsize=(15, 5))

# 첫 번째 하위 그래프
plt.subplot(1, 2, 1)
plt.title('cc_num=4.302480e+15')
nx.draw_networkx_nodes(subgraph1, pos1, node_size=200, node_color=node_colors1)
nx.draw_networkx_edges(subgraph1, pos1, edge_color='gray')
nx.draw_networkx_labels(subgraph1, pos1, font_size=10)
plt.axis('off')

# 두 번째 하위 그래프
plt.subplot(1, 2, 2)
plt.title('cc_num=2.242540e+15')
nx.draw_networkx_nodes(subgraph2, pos2, node_size=200, node_color=node_colors2)
nx.draw_networkx_edges(subgraph2, pos2, edge_color='gray')
nx.draw_networkx_labels(subgraph2, pos2, font_size=10)
plt.axis('off')

# 그래프 출력
plt.tight_layout()
plt.show()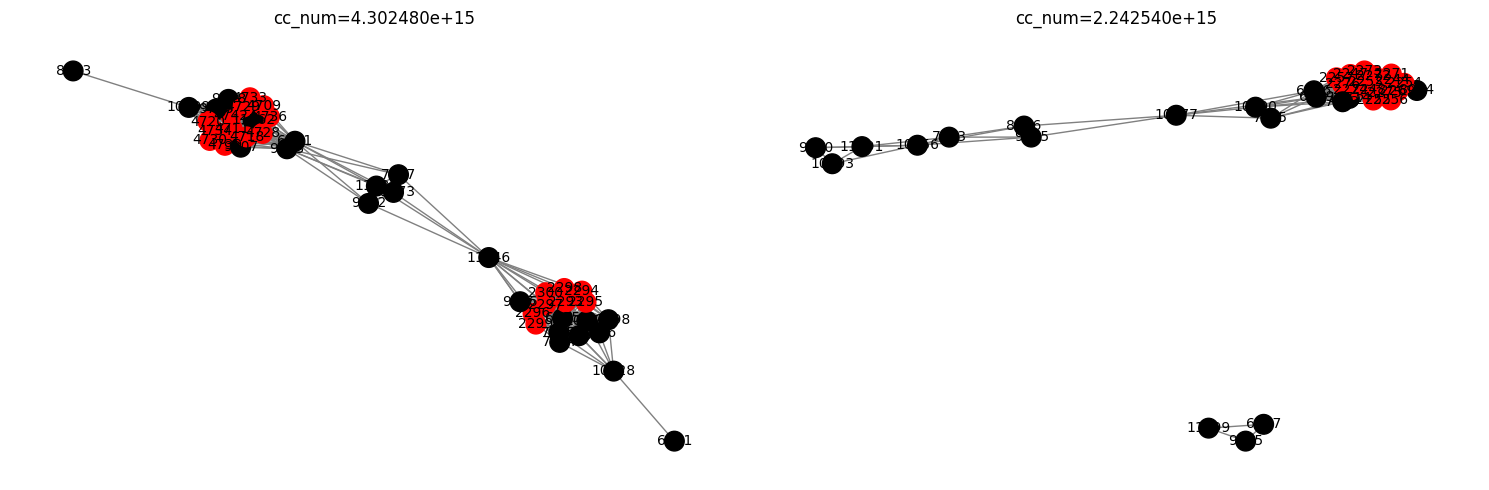
import networkx as nx
import matplotlib.pyplot as plt

# 4.30~에 해당하는 행의 인덱스를 찾음
selected_indices1 = df50[df50['cc_num'] == 4.302480e+15].index
selected_indices2 = df50[df50['cc_num'] == 2.242540e+15].index

# 선택된 인덱스에 대한 is_fraud 값을 가져옴
is_fraud_values1 = df50.loc[selected_indices1, 'is_fraud'].tolist()
is_fraud_values2 = df50.loc[selected_indices2, 'is_fraud'].tolist()

# PyTorch Geometric 그래프를 NetworkX 그래프로 변환
G = torch_geometric.utils.to_networkx(data, to_undirected=True)

# 첫 번째 서브그래프 추출
subgraph1 = G.subgraph(selected_indices1)

# 노드와 엣지 색상 설정 (서브그래프 1)
node_colors1 = ['r' if node in selected_indices1 and is_fraud_values1[selected_indices1.get_loc(node)] == 1 else 'k' for node in subgraph1.nodes()]

# 엣지 색상 설정 (파란색)
edge_colors1 = ['b' if (u, v) in subgraph1.edges() else 'gray' for u, v in subgraph1.edges()]

# 그래프 레이아웃 설정 (서브그래프 1)
pos1 = nx.spring_layout(subgraph1, seed=42)

# 두 번째 서브그래프 추출
subgraph2 = G.subgraph(selected_indices2)

# 노드와 엣지 색상 설정 (서브그래프 2)
node_colors2 = ['r' if node in selected_indices2 and is_fraud_values2[selected_indices2.get_loc(node)] == 1 else 'k' for node in subgraph2.nodes()]

# 엣지 색상 설정 (초록색)
edge_colors2 = ['g' if (u, v) in subgraph2.edges() else 'gray' for u, v in subgraph2.edges()]

# 그래프 레이아웃 설정 (서브그래프 2)
pos2 = nx.spring_layout(subgraph2, seed=43)

# 그래프 그리기
plt.figure(figsize=(10, 5))

# 첫 번째 하위 그래프
plt.title('cc_num=4.302480e+15')
nx.draw_networkx_nodes(subgraph1, pos1, node_size=200, node_color=node_colors1)
nx.draw_networkx_edges(subgraph1, pos1, edge_color=edge_colors1)
nx.draw_networkx_labels(subgraph1, pos1, font_size=10)

# 두 번째 하위 그래프
nx.draw_networkx_nodes(subgraph2, pos2, node_size=200, node_color=node_colors2)
nx.draw_networkx_edges(subgraph2, pos2, edge_color=edge_colors2)
nx.draw_networkx_labels(subgraph2, pos2, font_size=10)

# 축 숨기기
plt.axis('off')

# 그래프 출력
plt.show()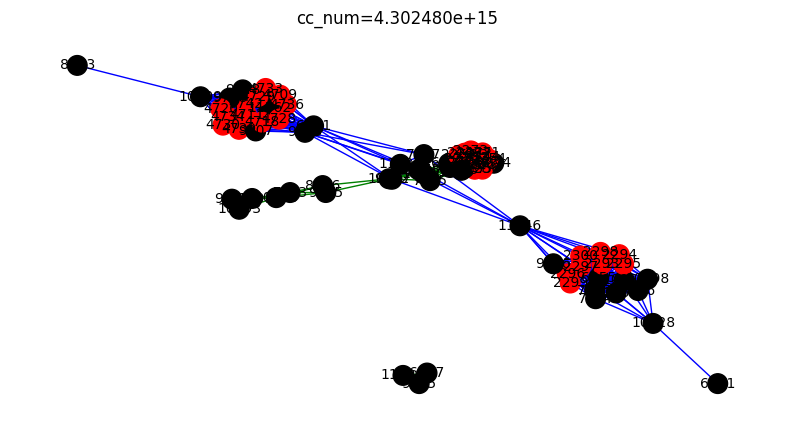
df50[df50['cc_num'] == 6.535330e+15].indexInt64Index([11740], dtype='int64')df50[df50['cc_num'] == 4.503100e+18].indexInt64Index([5381, 5382, 7996, 8217, 9176, 10248, 10517, 10613, 10950, 11321], dtype='int64')df50[df50['is_fraud'] == 1]['cc_num'].value_counts()2.131740e+14 24
3.506040e+15 23
1.800680e+14 22
6.011380e+15 22
1.800850e+14 21
..
6.011110e+15 2
4.809700e+12 2
3.576430e+15 2
4.503100e+18 2
3.546670e+15 2
Name: cc_num, Length: 596, dtype: int64import networkx as nx
import matplotlib.pyplot as plt
# PyTorch Geometric 그래프를 NetworkX 그래프로 변환
G = torch_geometric.utils.to_networkx(data, to_undirected=True)
subgraph = nx.ego_graph(G, 2293, radius=1)
# 그래프 시각화
pos = nx.spring_layout(subgraph) # 그래프 레이아웃 설정
# 노드 그리기
nx.draw_networkx_nodes(subgraph, pos, node_size=200)
# 엣지 그리기
nx.draw_networkx_edges(subgraph, pos)
# 노드 인덱스 표시
labels = {node: str(node) for node in subgraph.nodes()}
nx.draw_networkx_labels(subgraph, pos, labels, font_size=10)
# 그래프 출력
plt.axis('off') # 축 숨기기
plt.show()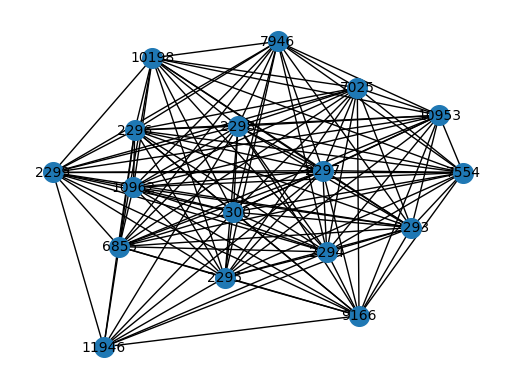
import networkx as nx
import matplotlib.pyplot as plt

# PyTorch Geometric 그래프를 NetworkX 그래프로 변환
G = torch_geometric.utils.to_networkx(data, to_undirected=True)

# 노드 1023과 연결된 모든 노드와 엣지를 포함하는 부분 그래프 추출
subgraph1 = nx.ego_graph(G, 2293, radius=1)
subgraph2 = nx.ego_graph(G, 11740, radius=1)

# 왼쪽 그래프 레이아웃 설정
pos1 = nx.spring_layout(subgraph1, pos=None, seed=42)  # 그래프 레이아웃 설정

# 오른쪽 그래프 레이아웃 설정
pos2 = nx.spring_layout(subgraph2, pos=None, seed=43)

# 노드 그리기
nx.draw_networkx_nodes(subgraph1, pos1, node_size=200, node_color='b', label='cc_num=4.302480e+15')
nx.draw_networkx_nodes(subgraph2, pos2, node_size=200, node_color='g', label='cc_num=6.535330e+15')

# 엣지 그리기
nx.draw_networkx_edges(subgraph1, pos1)
nx.draw_networkx_edges(subgraph2, pos2)

# 노드 인덱스 표시
labels1 = {node: str(node) for node in subgraph1.nodes()}
labels2 = {node: str(node) for node in subgraph2.nodes()}
nx.draw_networkx_labels(subgraph1, pos1, labels1, font_size=10)
nx.draw_networkx_labels(subgraph2, pos2, labels2, font_size=10)

# 그래프 출력
plt.axis('off')  # 축 숨기기

# 레이블 표시
plt.legend(loc='best')

plt.show()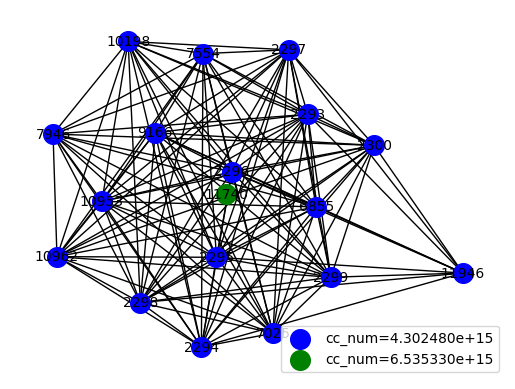
import networkx as nx
import matplotlib.pyplot as plt

# PyTorch Geometric 그래프를 NetworkX 그래프로 변환
G = torch_geometric.utils.to_networkx(data, to_undirected=True)

# 노드 1023과 연결된 모든 노드와 엣지를 포함하는 부분 그래프 추출
subgraph1 = nx.ego_graph(G, 2293, radius=1)
subgraph2 = nx.ego_graph(G, 8217, radius=1)

# 왼쪽 그래프 레이아웃 설정
pos1 = nx.spring_layout(subgraph1, pos=None, seed=42)  # 그래프 레이아웃 설정

# 오른쪽 그래프 레이아웃 설정
pos2 = nx.spring_layout(subgraph2, pos=None, seed=43)

# 두 개의 하위 그래프 생성
fig, (ax1, ax2) = plt.subplots(1, 2, figsize=(10, 5))

# 첫 번째 하위 그래프에 그래프 그리기
ax1.set_title('cc_num=4.302480e+15')
nx.draw_networkx_nodes(subgraph1, pos1, ax=ax1, node_size=200, node_color='b')
nx.draw_networkx_edges(subgraph1, pos1, ax=ax1)
labels1 = {node: str(node) for node in subgraph1.nodes()}
nx.draw_networkx_labels(subgraph1, pos1, labels1, font_size=10, ax=ax1)

# 두 번째 하위 그래프에 그래프 그리기
ax2.set_title('cc_num=4.503100e+18')
nx.draw_networkx_nodes(subgraph2, pos2, ax=ax2, node_size=200, node_color='g')
nx.draw_networkx_edges(subgraph2, pos2, ax=ax2)
labels2 = {node: str(node) for node in subgraph2.nodes()}
nx.draw_networkx_labels(subgraph2, pos2, labels2, font_size=10, ax=ax2)

# 축 숨기기
ax1.axis('off')
ax2.axis('off')

# 그래프 출력
plt.tight_layout()
plt.show()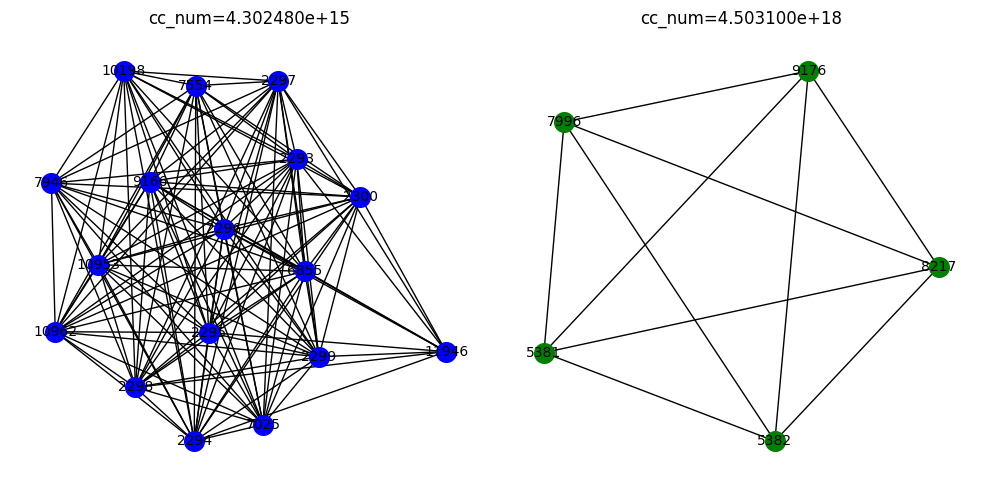
import networkx as nx
import matplotlib.pyplot as plt

# PyTorch Geometric 그래프를 NetworkX 그래프로 변환
G = torch_geometric.utils.to_networkx(data, to_undirected=True)

# 노드 1023과 연결된 모든 노드와 엣지를 포함하는 부분 그래프 추출
subgraph1 = nx.ego_graph(G, 2293, radius=1)
subgraph2 = nx.ego_graph(G, 8217, radius=1)

# 왼쪽 그래프 레이아웃 설정
pos1 = nx.spring_layout(subgraph1, pos=None, seed=42)  # 그래프 레이아웃 설정

# 오른쪽 그래프 레이아웃 설정
pos2 = nx.spring_layout(subgraph2, pos=None, seed=43)

# 두 개의 하위 그래프 생성
fig, (ax1, ax2) = plt.subplots(1, 2, figsize=(10, 5))

# 첫 번째 하위 그래프에 그래프 그리기
ax1.set_title('cc_num=4.302480e+15')
nx.draw_networkx_nodes(subgraph1, pos1, ax=ax1, node_size=200, node_color='b')
labels1 = {node: str(node) for node in subgraph1.nodes()}

# 엣지 색상 설정 (is_fraud가 1일 때 빨간색, 그 외에는 검정색)
edge_colors1 = ['r' if subgraph1[u][v].get('is_fraud', 0) == 1 else 'k' for u, v in subgraph1.edges()]
nx.draw_networkx_edges(subgraph1, pos1, edgelist=subgraph1.edges(), edge_color=edge_colors1, ax=ax1)
nx.draw_networkx_labels(subgraph1, pos1, labels1, font_size=10, ax=ax1)

# 두 번째 하위 그래프에 그래프 그리기
ax2.set_title('cc_num=4.503100e+18')
nx.draw_networkx_nodes(subgraph2, pos2, ax=ax2, node_size=200, node_color='g')
labels2 = {node: str(node) for node in subgraph2.nodes()}

# 엣지 색상 설정 (is_fraud가 1일 때 빨간색, 그 외에는 검정색)
edge_colors2 = ['r' if subgraph2[u][v].get('is_fraud', 0) == 1 else 'k' for u, v in subgraph2.edges()]
nx.draw_networkx_edges(subgraph2, pos2, edgelist=subgraph2.edges(), edge_color=edge_colors2, ax=ax2)
nx.draw_networkx_labels(subgraph2, pos2, labels2, font_size=10, ax=ax2)

# 축 숨기기
ax1.axis('off')
ax2.axis('off')

# 그래프 출력
plt.tight_layout()
plt.show()
- fraud값이 1인게 표시가 안되네??
dataData(x=[12012, 1], edge_index=<function edge_index_selected at 0x7f3f8d358ee0>, y=[12012], train_mask=[12012], test_mask=[12012])data.edge_index<function __main__.edge_index_selected(edge_index)>x = torch.tensor(df50['amt'], dtype=torch.float).reshape(-1,1)
y = torch.tensor(df50['is_fraud'],dtype=torch.int64)
data = torch_geometric.data.Data(x=x, edge_index = edge_index_selected, y=y, train_mask = train_mask, test_mask = test_mask)
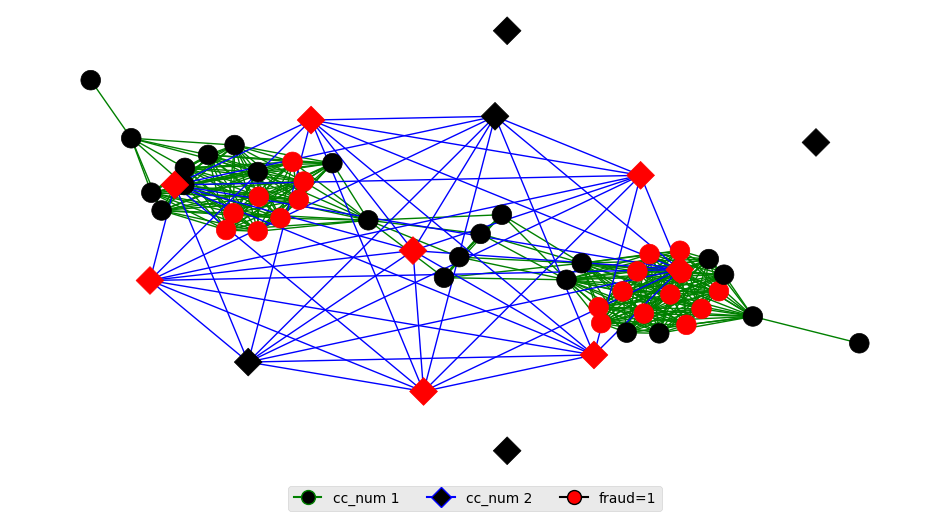
dataData(x=[12012, 1], edge_index=[2, 93730], y=[12012], train_mask=[12012], test_mask=[12012])- ppt 삽입할 그래프.
- cc_num
거래량이 가장 많은 cc_num:4.302480e+15
거래량 평균인cc_num: 4.2929e+18
import networkx as nx
import matplotlib.pyplot as plt

# 4.50~에 해당하는 행의 인덱스를 찾음
selected_indices = df50[df50['cc_num'] == 4.302480e+15].index

# 선택된 인덱스에 대한 is_fraud 값을 가져옴
is_fraud_values = df50.loc[selected_indices, 'is_fraud'].tolist()

# PyTorch Geometric 그래프를 NetworkX 그래프로 변환
G = torch_geometric.utils.to_networkx(data, to_undirected=True)

# 서브그래프를 추출
subgraph = G.subgraph(selected_indices)

# 노드와 엣지 색상을 설정
node_colors = ['r' if node in selected_indices and is_fraud_values[selected_indices.get_loc(node)] == 1 else 'k' for node in subgraph.nodes()]

# 그래프 레이아웃 설정
pos = nx.spring_layout(subgraph, seed=42)

# 그래프 그리기
plt.figure(figsize=(10, 5))
nx.draw_networkx_nodes(subgraph, pos, node_size=200, node_color=node_colors)
nx.draw_networkx_edges(subgraph, pos, edge_color='gray')
nx.draw_networkx_labels(subgraph, pos, font_size=10)

# 축 숨기기
plt.axis('off')

# 그래프 출력
plt.show()
import networkx as nx
import matplotlib.pyplot as plt

# 4.50~에 해당하는 행의 인덱스를 찾음
selected_indices = df50[df50['cc_num'] == 4.2929e+18].index

# 선택된 인덱스에 대한 is_fraud 값을 가져옴
is_fraud_values = df50.loc[selected_indices, 'is_fraud'].tolist()

# PyTorch Geometric 그래프를 NetworkX 그래프로 변환
G = torch_geometric.utils.to_networkx(data, to_undirected=True)

# 서브그래프를 추출
subgraph = G.subgraph(selected_indices)

# 노드와 엣지 색상을 설정
node_colors = ['r' if node in selected_indices and is_fraud_values[selected_indices.get_loc(node)] == 1 else 'k' for node in subgraph.nodes()]

# 그래프 레이아웃 설정
pos = nx.spring_layout(subgraph, seed=42)

# 그래프 그리기
plt.figure(figsize=(10, 5))
nx.draw_networkx_nodes(subgraph, pos, node_size=200, node_color=node_colors)
nx.draw_networkx_edges(subgraph, pos, edge_color='gray')
nx.draw_networkx_labels(subgraph, pos, font_size=10)

# 축 숨기기
plt.axis('off')

# 그래프 출력
plt.show()
import networkx as nx
import matplotlib.pyplot as plt

# 첫 번째 데이터 선택
selected_indices1 = df50[df50['cc_num'] == 4.302480e+15].index
is_fraud_values1 = df50.loc[selected_indices1, 'is_fraud'].tolist()

# 두 번째 데이터 선택
selected_indices2 = df50[df50['cc_num'] == 4.2929e+18].index
is_fraud_values2 = df50.loc[selected_indices2, 'is_fraud'].tolist()

# PyTorch Geometric 그래프를 NetworkX 그래프로 변환
G = torch_geometric.utils.to_networkx(data, to_undirected=True)

# 서브그래프 추출
subgraph1 = G.subgraph(selected_indices1)
subgraph2 = G.subgraph(selected_indices2)

# 노드 색상 설정
node_colors1 = ['r' if node in selected_indices1 and is_fraud_values1[selected_indices1.get_loc(node)] == 1 else 'k' for node in subgraph1.nodes()]
node_colors2 = ['r' if node in selected_indices2 and is_fraud_values2[selected_indices2.get_loc(node)] == 1 else 'k' for node in subgraph2.nodes()]

# 엣지 색상 설정
edge_colors1 = ['g' if edge in subgraph1.edges() else 'k' for edge in subgraph1.edges()]
edge_colors2 = ['b' if edge in subgraph2.edges() else 'k' for edge in subgraph2.edges()]

# 그래프 레이아웃 설정
pos1 = nx.spring_layout(subgraph1, seed=42)
pos2 = nx.spring_layout(subgraph2, seed=42)

# 그래프 그리기
plt.figure(figsize=(12, 6))

# 그래프 1 그리기
nx.draw_networkx_nodes(subgraph1, pos1, node_size=200, node_color=node_colors1)
nx.draw_networkx_edges(subgraph1, pos1, edge_color=edge_colors1)

# 그래프 2 그리기
nx.draw_networkx_nodes(subgraph2, pos2, node_size=200, node_color=node_colors2)
nx.draw_networkx_edges(subgraph2, pos2, edge_color=edge_colors2)

# 축 숨기기
plt.axis('off')

# 그래프 출력
plt.show()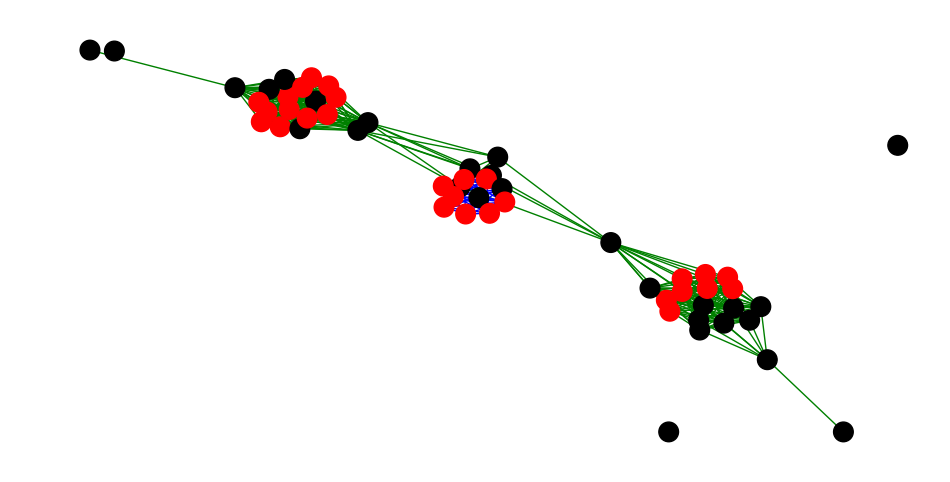
import networkx as nx
import matplotlib.pyplot as plt
import matplotlib.style as style

# 스타일 설정 (ggplot 스타일 사용)
style.use('ggplot')

# 첫 번째 데이터 선택
selected_indices1 = df50[df50['cc_num'] == 4.302480e+15].index
is_fraud_values1 = df50.loc[selected_indices1, 'is_fraud'].tolist()

# 두 번째 데이터 선택
selected_indices2 = df50[df50['cc_num'] == 4.2929e+18].index
is_fraud_values2 = df50.loc[selected_indices2, 'is_fraud'].tolist()

# PyTorch Geometric 그래프를 NetworkX 그래프로 변환
G = torch_geometric.utils.to_networkx(data, to_undirected=True)

# 서브그래프 추출
subgraph1 = G.subgraph(selected_indices1)
subgraph2 = G.subgraph(selected_indices2)

# 노드 색상 설정
node_colors1 = ['r' if node in selected_indices1 and is_fraud_values1[selected_indices1.get_loc(node)] == 1 else 'k' for node in subgraph1.nodes()]
node_colors2 = ['r' if node in selected_indices2 and is_fraud_values2[selected_indices2.get_loc(node)] == 1 else 'k' for node in subgraph2.nodes()]

# 엣지 색상 설정
edge_colors1 = ['g' if edge in subgraph1.edges() else 'k' for edge in subgraph1.edges()]
edge_colors2 = ['b' if edge in subgraph2.edges() else 'k' for edge in subgraph2.edges()]

# 그래프 레이아웃 설정 (kamada_kawai 레이아웃 사용)
pos1 = nx.kamada_kawai_layout(subgraph1)
pos2 = nx.kamada_kawai_layout(subgraph2)

# 그래프 그리기
plt.figure(figsize=(12, 6))

# 그래프 1 그리기
nx.draw_networkx_nodes(subgraph1, pos1, node_size=200, node_color=node_colors1, node_shape='o')  # 노드 모양: 원 (circle)
nx.draw_networkx_edges(subgraph1, pos1, edge_color=edge_colors1)

# 그래프 2 그리기
nx.draw_networkx_nodes(subgraph2, pos2, node_size=200, node_color=node_colors2, node_shape='D')  # 노드 모양: 다이아몬드 (diamond)
nx.draw_networkx_edges(subgraph2, pos2, edge_color=edge_colors2)

# 범례 추가
legend_elements = [
    plt.Line2D([0], [0], marker='o', color='g', markerfacecolor='black', markersize=10, label='cc_num 1'),
    plt.Line2D([0], [0], marker='D', color='b', markerfacecolor='black', markersize=10, label='cc_num 2'),
    plt.Line2D([0], [0], marker='o', color='black', markerfacecolor='r', markersize=10, label='fraud=1'),
]
plt.legend(handles=legend_elements, loc='lower center', ncol=3, frameon=True)

# 그래프 출력
plt.axis('off')
plt.show()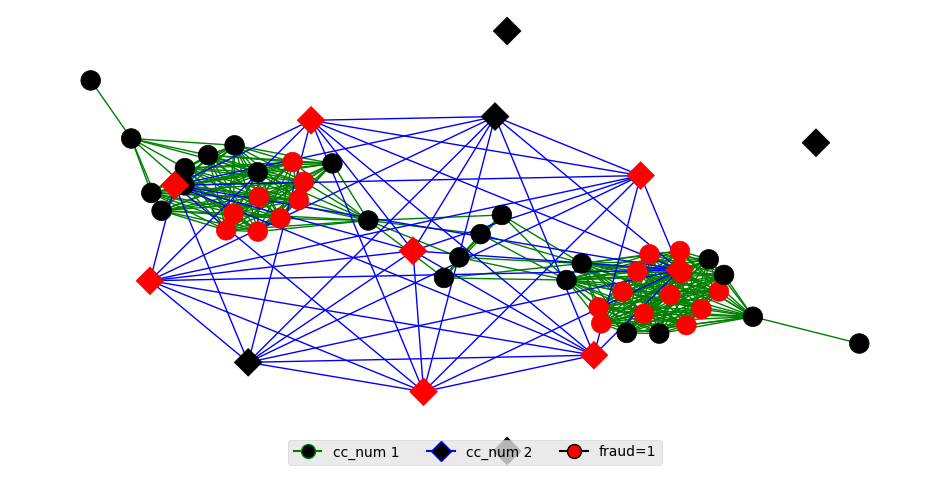
import networkx as nx
import matplotlib.pyplot as plt
import matplotlib.style as style

# 스타일 설정 (ggplot 스타일 사용)
style.use('ggplot')

# 첫 번째 데이터 선택
selected_indices1 = df50[df50['cc_num'] == 4.302480e+15].index
is_fraud_values1 = df50.loc[selected_indices1, 'is_fraud'].tolist()

# 두 번째 데이터 선택
selected_indices2 = df50[df50['cc_num'] == 4.2929e+18].index
is_fraud_values2 = df50.loc[selected_indices2, 'is_fraud'].tolist()

# PyTorch Geometric 그래프를 NetworkX 그래프로 변환
G = torch_geometric.utils.to_networkx(data, to_undirected=True)

# 서브그래프 추출
subgraph1 = G.subgraph(selected_indices1)
subgraph2 = G.subgraph(selected_indices2)

# 노드 색상 설정
node_colors1 = ['r' if node in selected_indices1 and is_fraud_values1[selected_indices1.get_loc(node)] == 1 else 'k' for node in subgraph1.nodes()]
node_colors2 = ['r' if node in selected_indices2 and is_fraud_values2[selected_indices2.get_loc(node)] == 1 else 'k' for node in subgraph2.nodes()]

# 엣지 색상 설정
edge_colors1 = ['g' if edge in subgraph1.edges() else 'k' for edge in subgraph1.edges()]
edge_colors2 = ['b' if edge in subgraph2.edges() else 'k' for edge in subgraph2.edges()]

# 그래프 레이아웃 설정 (kamada_kawai 레이아웃 사용)
pos1 = nx.kamada_kawai_layout(subgraph1)
pos2 = nx.kamada_kawai_layout(subgraph2)

# 그래프 그리기
plt.figure(figsize=(12, 6))

# 그래프 1 그리기
nx.draw_networkx_nodes(subgraph1, pos1, node_size=200, node_color=node_colors1, node_shape='o')  # 노드 모양: 원 (circle)
nx.draw_networkx_edges(subgraph1, pos1, edge_color=edge_colors1)

# 그래프 2 그리기
nx.draw_networkx_nodes(subgraph2, pos2, node_size=200, node_color=node_colors2, node_shape='D')  # 노드 모양: 다이아몬드 (diamond)
nx.draw_networkx_edges(subgraph2, pos2, edge_color=edge_colors2)

# 범례 추가
legend_elements = [
    plt.Line2D([0], [0], marker='o', color='g', markerfacecolor='black', markersize=10, label='cc_num 1'),
    plt.Line2D([0], [0], marker='D', color='b', markerfacecolor='black', markersize=10, label='cc_num 2'),
    plt.Line2D([0], [0], marker='o', color='black', markerfacecolor='r', markersize=10, label='fraud=1'),
]
legend = plt.legend(handles=legend_elements, loc='lower center', ncol=3, frameon=True)
legend.set_bbox_to_anchor((0.5, -0.1))  # 범례 위치 조정

# 그래프 출력
plt.axis('off')
plt.show()