import numpy as np
import pandas as pd
import matplotlib.pyplot as plt
import sklearn.linear_model해당 자료는 전북대학교 최규빈 교수님 2023학년도 2학기 빅데이터분석특강 자료임
03wk-012: 취업, 로지스틱
최규빈
2023-09-21
1. 강의영상
https://youtu.be/playlist?list=PLQqh36zP38-z03THS4jG11HPcozk3ZfVS&si=Ry49nDAOI3PSu0Ja
2. Imports
3. 데이터 불러오기
df = pd.read_csv('https://raw.githubusercontent.com/guebin/MP2023/main/posts/employment.csv')
df| toeic | gpa | employment | |
|---|---|---|---|
| 0 | 135 | 0.051535 | 0 |
| 1 | 935 | 0.355496 | 0 |
| 2 | 485 | 2.228435 | 0 |
| 3 | 65 | 1.179701 | 0 |
| 4 | 445 | 3.962356 | 1 |
| ... | ... | ... | ... |
| 495 | 280 | 4.288465 | 1 |
| 496 | 310 | 2.601212 | 1 |
| 497 | 225 | 0.042323 | 0 |
| 498 | 320 | 1.041416 | 0 |
| 499 | 375 | 3.626883 | 1 |
500 rows × 3 columns
plt.plot(df.toeic,df.gpa,'o')
df_filtered = df[df.employment==1]
plt.plot(df_filtered.toeic,df_filtered.gpa,'o')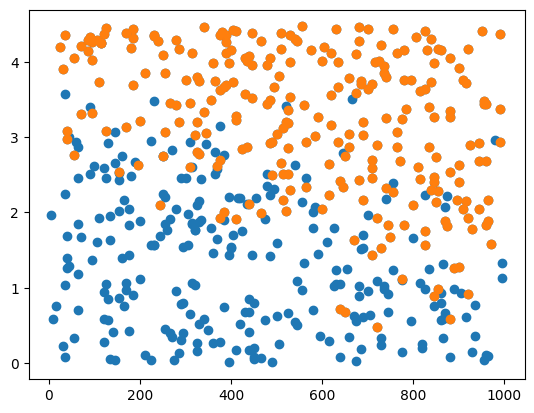
- 주황색이 합격
4. 분석
A. 데이터 정리
X = pd.get_dummies(df[['toeic','gpa']])
y = df[['employment']]X| toeic | gpa | |
|---|---|---|
| 0 | 135 | 0.051535 |
| 1 | 935 | 0.355496 |
| 2 | 485 | 2.228435 |
| 3 | 65 | 1.179701 |
| 4 | 445 | 3.962356 |
| ... | ... | ... |
| 495 | 280 | 4.288465 |
| 496 | 310 | 2.601212 |
| 497 | 225 | 0.042323 |
| 498 | 320 | 1.041416 |
| 499 | 375 | 3.626883 |
500 rows × 2 columns
B. Predictor (\(\star\star\star\))
- 여기가 중요함. \(y\)가 연속형이 아니라 범주형(취업/미취업)으로 이루어진 경우는 sklearn.linear_model.LogisticRegression() 이용하여 predictor를 만들 것
predictr = sklearn.linear_model.LogisticRegression()predictrLogisticRegression()In a Jupyter environment, please rerun this cell to show the HTML representation or trust the notebook.
On GitHub, the HTML representation is unable to render, please try loading this page with nbviewer.org.
LogisticRegression()
C. 학습
predictr.fit(X,y)/home/coco/anaconda3/envs/py38/lib/python3.8/site-packages/sklearn/utils/validation.py:1143: DataConversionWarning: A column-vector y was passed when a 1d array was expected. Please change the shape of y to (n_samples, ), for example using ravel().
y = column_or_1d(y, warn=True)LogisticRegression()In a Jupyter environment, please rerun this cell to show the HTML representation or trust the notebook.
On GitHub, the HTML representation is unable to render, please try loading this page with nbviewer.org.
LogisticRegression()
D. 예측
predictr.predict(X) array([0, 0, 0, 0, 1, 0, 0, 0, 1, 0, 0, 1, 1, 0, 1, 0, 0, 1, 1, 0, 1, 1,
1, 1, 1, 1, 1, 0, 0, 0, 0, 0, 1, 1, 1, 0, 0, 0, 0, 0, 0, 0, 1, 1,
0, 0, 1, 0, 1, 0, 1, 1, 1, 0, 0, 0, 0, 0, 1, 0, 0, 0, 1, 1, 1, 0,
0, 1, 0, 0, 0, 0, 1, 1, 0, 0, 0, 1, 1, 1, 1, 0, 0, 1, 1, 0, 1, 1,
1, 1, 1, 1, 1, 1, 1, 1, 0, 1, 0, 0, 1, 1, 0, 0, 0, 0, 1, 0, 1, 0,
1, 0, 1, 0, 1, 1, 1, 0, 1, 1, 0, 0, 0, 0, 1, 1, 1, 1, 0, 1, 0, 0,
1, 0, 0, 1, 1, 1, 1, 1, 1, 1, 1, 1, 0, 1, 1, 0, 1, 1, 0, 1, 1, 1,
0, 0, 0, 1, 1, 0, 0, 1, 0, 0, 0, 1, 1, 1, 1, 0, 1, 0, 1, 1, 0, 1,
1, 1, 1, 1, 0, 1, 1, 0, 1, 0, 0, 1, 0, 1, 0, 0, 1, 1, 0, 0, 1, 1,
1, 1, 1, 1, 1, 1, 0, 1, 0, 0, 0, 1, 0, 1, 0, 1, 0, 1, 0, 0, 1, 1,
0, 0, 1, 0, 1, 0, 0, 0, 1, 1, 1, 0, 0, 1, 0, 0, 0, 1, 1, 1, 1, 0,
1, 1, 1, 0, 0, 0, 0, 0, 0, 1, 0, 1, 0, 1, 1, 0, 1, 1, 0, 0, 0, 0,
0, 0, 1, 1, 0, 1, 1, 1, 0, 0, 1, 1, 1, 0, 1, 1, 0, 1, 0, 1, 1, 0,
0, 1, 1, 1, 0, 1, 0, 1, 0, 0, 0, 1, 0, 0, 0, 0, 1, 1, 0, 0, 1, 1,
0, 0, 0, 0, 0, 0, 1, 0, 1, 1, 1, 1, 0, 0, 1, 1, 0, 0, 0, 1, 1, 0,
0, 1, 1, 1, 0, 1, 0, 1, 0, 0, 1, 1, 1, 1, 0, 1, 0, 0, 0, 1, 1, 1,
0, 1, 0, 0, 0, 1, 0, 0, 1, 0, 0, 1, 1, 1, 0, 1, 1, 1, 1, 1, 0, 1,
0, 0, 0, 0, 1, 1, 1, 0, 0, 0, 1, 1, 0, 0, 0, 1, 0, 0, 1, 0, 1, 1,
0, 1, 1, 0, 0, 0, 1, 0, 1, 0, 1, 1, 0, 0, 1, 1, 1, 1, 0, 1, 0, 0,
0, 0, 1, 1, 0, 0, 1, 0, 0, 1, 0, 0, 0, 1, 1, 1, 0, 1, 0, 1, 0, 1,
1, 1, 0, 1, 1, 1, 1, 1, 0, 1, 1, 1, 0, 1, 1, 1, 0, 1, 0, 0, 0, 1,
0, 1, 0, 1, 1, 0, 1, 0, 1, 0, 1, 0, 1, 0, 0, 1, 0, 1, 0, 1, 1, 0,
0, 0, 1, 1, 0, 0, 0, 0, 0, 0, 1, 1, 0, 0, 0, 1])E. 평가
predictr.score(X,y)0.882(predictr.predict(X) == y.employment).mean()0.882plt.plot(df.toeic,df.gpa,'o')
df_filtered = df[predictr.predict(X)==1]
plt.plot(df_filtered.toeic,df_filtered.gpa,'o') 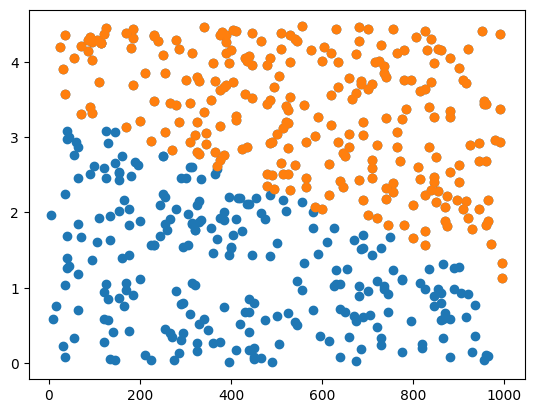
- 이 정도면 합리적임