import numpy as np
import pandas as pd
import sklearn.linear_model
import matplotlib.pyplot as plt해당 자료는 전북대학교 최규빈 교수님 2023학년도 2학기 빅데이터분석특강 자료임
07wk-027: 아이스크림(이상치) / 회귀분석
최규빈
2023-10-17
1. 강의영상
https://youtu.be/playlist?list=PLQqh36zP38-yf6Ht2bBpj-mf50aPboSsu&si=6dYX9WfoPmbbbGsG
2. Imports
3. Data
np.random.seed(43052)
temp = pd.read_csv('https://raw.githubusercontent.com/guebin/DV2022/master/posts/temp.csv').iloc[:100,3].to_numpy()
temp.sort()
ice_sales = 10 + temp * 0.5 + np.random.randn(100)
ice_sales[0] = 200
df_train = pd.DataFrame({'temp':temp,'ice_sales':ice_sales})
df_train| temp | ice_sales | |
|---|---|---|
| 0 | -4.1 | 200.000000 |
| 1 | -3.7 | 9.234175 |
| 2 | -3.0 | 9.642778 |
| 3 | -1.3 | 9.657894 |
| 4 | -0.5 | 9.987787 |
| ... | ... | ... |
| 95 | 12.4 | 17.508688 |
| 96 | 13.4 | 17.105376 |
| 97 | 14.7 | 17.164930 |
| 98 | 15.0 | 18.555388 |
| 99 | 15.2 | 18.787014 |
100 rows × 2 columns
plt.plot(df_train.temp,df_train.ice_sales,'o')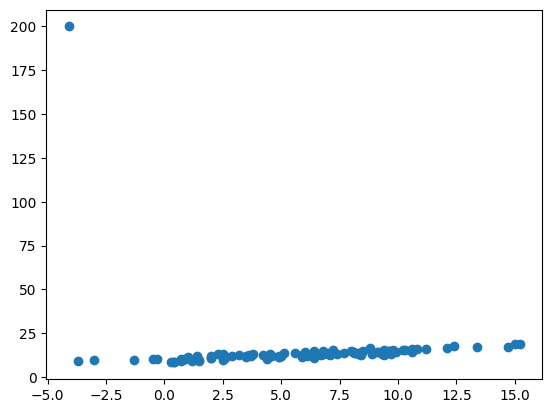
이상점 한개
plt.plot(df_train.temp[1:], df_train.ice_sales[1:],'o')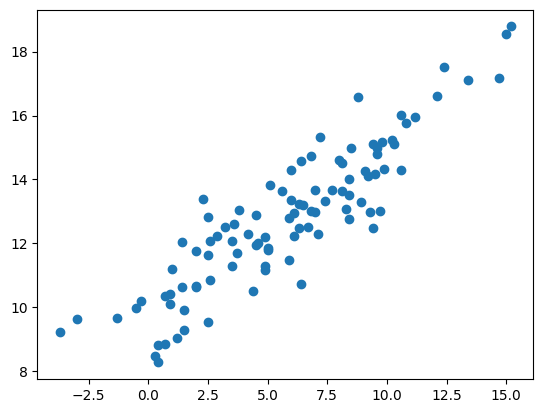
이상점 제외하고 그린 그림
- 상상: 온도가 -4.1인 지점에서 “썰매축제”가 열렸다고 가정하자. 그래서 사람이 갑자기 많이 왔음. 그래서 아이스크림이 많이 팔렸음.
4. 분석
- 선형회귀로 적합
# step1
X,y = df_train[['temp']], df_train['ice_sales']
# step2
predictr = sklearn.linear_model.LinearRegression()
# step3
predictr.fit(X,y)
# step4
df_train['ice_sales_hat'] = predictr.predict(X)predictr.coef_array([-0.64479089])- 시각화
plt.plot(df_train.temp,df_train.ice_sales,'o')
plt.plot(df_train.temp,df_train.ice_sales_hat,'--')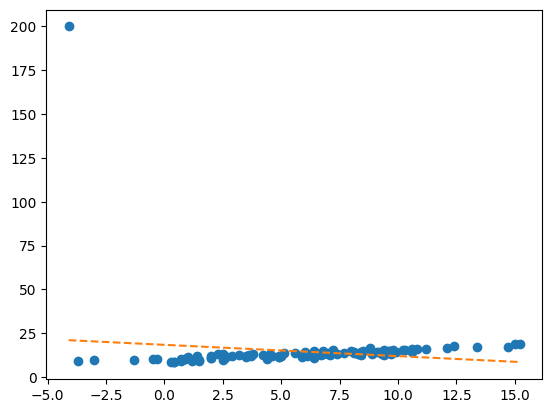
# plt.plot(df_train.temp,df_train.ice_sales,'o')
# plt.plot(df_train.temp,df_train.ice_sales_hat,'--')
plt.plot(df_train.temp[1:],df_train.ice_sales[1:],'o')
plt.plot(df_train.temp[1:],df_train.ice_sales_hat[1:],'--')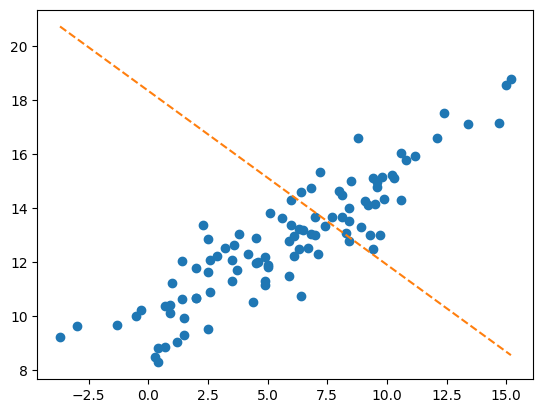
- 새로운 unseen data를 가정, 데이터는 온도가 12.5~18 에 걸쳐있다고 가정한다.
df_train| temp | ice_sales | ice_sales_hat | |
|---|---|---|---|
| 0 | -4.1 | 200.000000 | 20.989373 |
| 1 | -3.7 | 9.234175 | 20.731457 |
| 2 | -3.0 | 9.642778 | 20.280103 |
| 3 | -1.3 | 9.657894 | 19.183959 |
| 4 | -0.5 | 9.987787 | 18.668126 |
| ... | ... | ... | ... |
| 95 | 12.4 | 17.508688 | 10.350324 |
| 96 | 13.4 | 17.105376 | 9.705533 |
| 97 | 14.7 | 17.164930 | 8.867305 |
| 98 | 15.0 | 18.555388 | 8.673867 |
| 99 | 15.2 | 18.787014 | 8.544909 |
100 rows × 3 columns
XX = df_test = pd.DataFrame({'temp':np.linspace(12.5,18,50)})
df_test['ice_sales_hat'] = predictr.predict(XX)
plt.plot(df_train.temp[1:],df_train.ice_sales[1:],'o')
plt.plot(df_train.temp[1:],df_train.ice_sales_hat[1:],'--')
plt.plot(df_test.temp,df_test.ice_sales_hat,'--')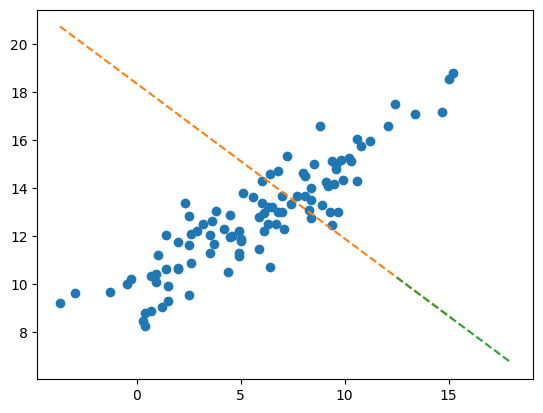
f'train score = {predictr.score(X,y):.4f}''train score = 0.0193'- 온도가 올라갈수록 아이스크림 판매량은 줄어든다는 해석 (더 온도가 올라간다면 판매량이 음수가 나올 수도 있겠음 )
- 저 정도의 아웃라이어는 모형에서 제외하는게 타당하지 않나? (하지만 저러한 아웃라이어가 데이터의 가치가 있을 수도 있음. 그런데 또 데이터의 가치가 있는지 없는지는 어떻게 판단하지?)
5. Discussion
- 딱히 정답이 없음..