import numpy as np
import pandas as pd
import matplotlib.pyplot as plt
import sklearn.tree
import graphviz
#---#
import warnings
warnings.filterwarnings('ignore')11wk-040: Medical Cost / 의사결정나무의 시각화
최규빈
2023-11-16
1. 강의영상
https://youtu.be/playlist?list=PLQqh36zP38-wy5HZfyF9HIZKvAXrdBwzO&si=vTJ3EiJLr487p2DT
2. Imports
3. 데이터준비 + 적합
df_train = pd.read_csv('https://raw.githubusercontent.com/guebin/MP2023/main/posts/insurance.csv')
df_train| age | sex | bmi | children | smoker | region | charges | |
|---|---|---|---|---|---|---|---|
| 0 | 19 | female | 27.900 | 0 | yes | southwest | 16884.92400 |
| 1 | 18 | male | 33.770 | 1 | no | southeast | 1725.55230 |
| 2 | 28 | male | 33.000 | 3 | no | southeast | 4449.46200 |
| 3 | 33 | male | 22.705 | 0 | no | northwest | 21984.47061 |
| 4 | 32 | male | 28.880 | 0 | no | northwest | 3866.85520 |
| ... | ... | ... | ... | ... | ... | ... | ... |
| 1333 | 50 | male | 30.970 | 3 | no | northwest | 10600.54830 |
| 1334 | 18 | female | 31.920 | 0 | no | northeast | 2205.98080 |
| 1335 | 18 | female | 36.850 | 0 | no | southeast | 1629.83350 |
| 1336 | 21 | female | 25.800 | 0 | no | southwest | 2007.94500 |
| 1337 | 61 | female | 29.070 | 0 | yes | northwest | 29141.36030 |
1338 rows × 7 columns
# step1
X = pd.get_dummies(df_train.loc[:,'age':'region'])
y = df_train['charges']
# step2
predictr = sklearn.tree.DecisionTreeRegressor(max_depth=3)
# step3
predictr.fit(X,y)
# step4 -- pass DecisionTreeRegressor(max_depth=3)In a Jupyter environment, please rerun this cell to show the HTML representation or trust the notebook.
On GitHub, the HTML representation is unable to render, please try loading this page with nbviewer.org.
DecisionTreeRegressor(max_depth=3)
4. matplotlib 기반 시각화
A. 기본시각화
sklearn.tree.plot_tree(predictr);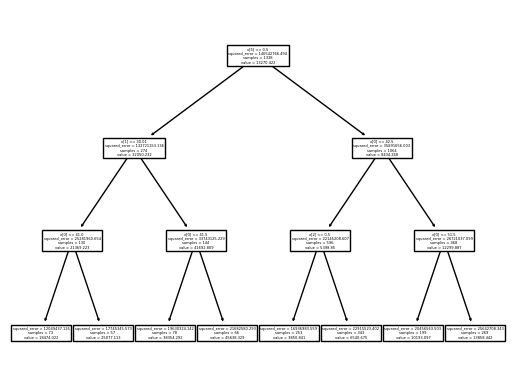
- 잘 안보임
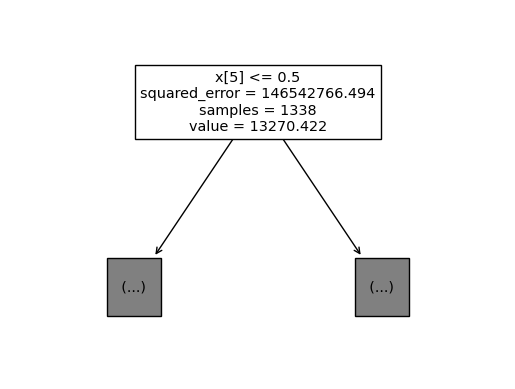
B. max_depth 조정
sklearn.tree.plot_tree(
    predictr,
    max_depth=0
);
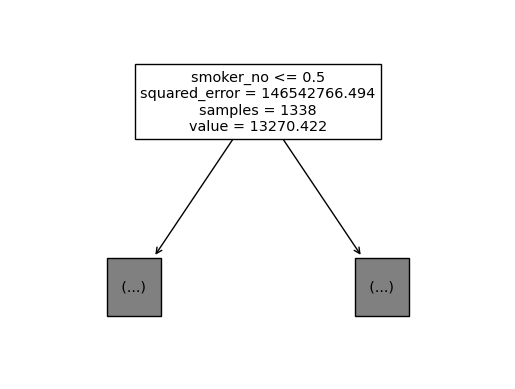
C. 변수이름 추가
sklearn.tree.plot_tree(
    predictr,
    max_depth=0,
    feature_names=X.columns
);
D. fig 오브젝트
- plt.gcf()를 이용하여 fig 오브젝트 추출
sklearn.tree.plot_tree(
    predictr,
    max_depth=1,
    feature_names=X.columns
);
fig = plt.gcf()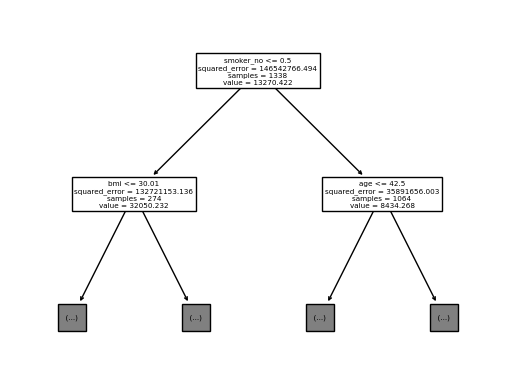
- fig.suptitle 을 이용하여 제목을 붙일 수도 있지 않을까?
fig.suptitle("title??")Text(0.5, 0.98, 'title??')fig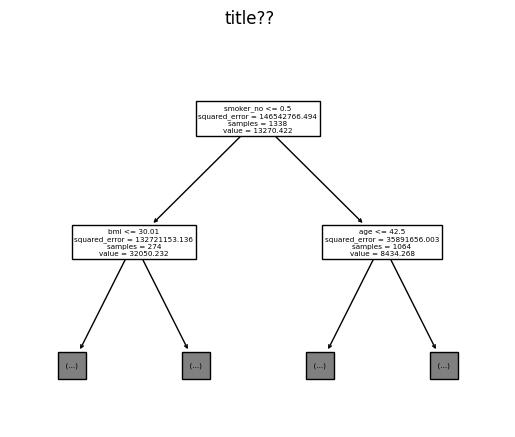
- dpi(해상도) 조정
fig.set_dpi(250)
fig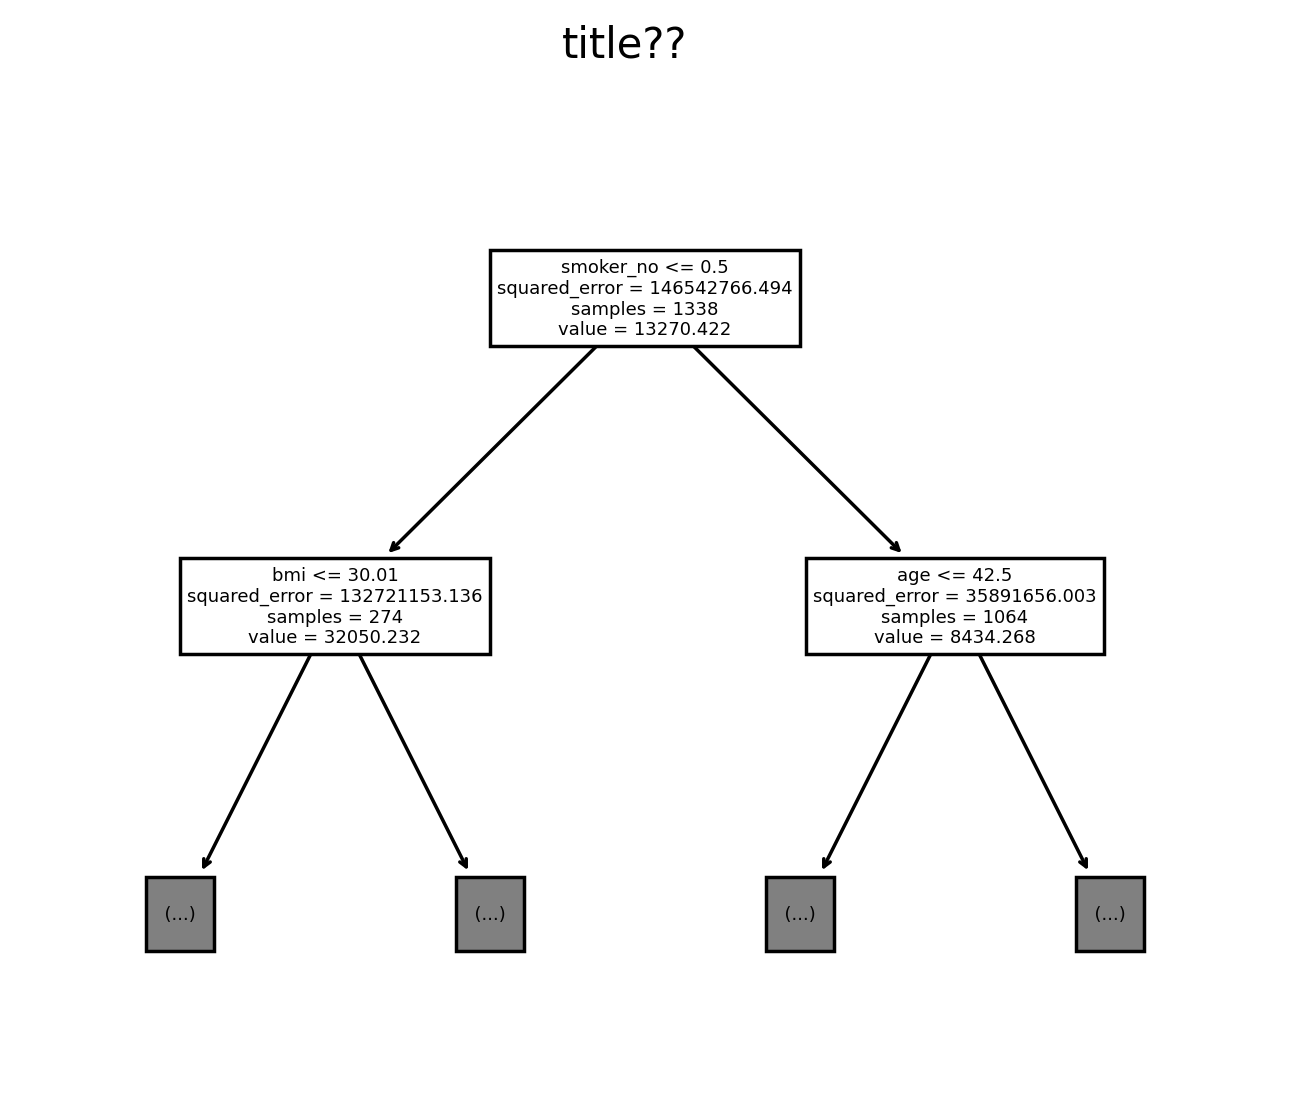
E. matplotlib의 ax에 그리기
fig = plt.figure()
ax = fig.subplots(2,1)
ax[0].plot(y,y,'--')
ax[0].plot(y,predictr.predict(X),'o',alpha=0.1)
sklearn.tree.plot_tree(predictr,feature_names=X.columns,ax=ax[1],max_depth=0);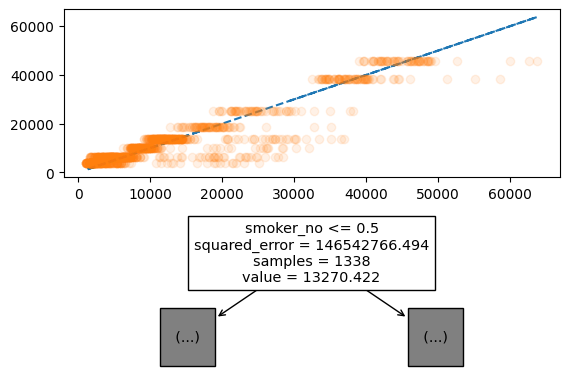
5. GraphViz 를 이용
g = sklearn.tree.export_graphviz(
    predictr,
    feature_names=X.columns
)
graphviz.Source(g)
- 보기에 훨씬 깔끔함
- 파일로 추출하여 저장하는 방법
g = sklearn.tree.export_graphviz(
    predictr,
    feature_names=X.columns
)
graphviz.Source(g).render('tree',format="pdf")'tree.pdf'tree.pdf이 생성되고 이 파일을 열면 tree의 구조를 쉽게 파악할 수 있음.
6. HW
tree.pdf 파일을 제출